Long-term investment returns are not just about capturing rising markets. Protecting value during market downturns is also crucial.
At Walter Scott, we frequently use the word ‘resilient’. When we analyse a company, we try to ascertain if it is capable of sustaining high levels of growth over the long term. That is one side of the return equation.
But we also ask how resilient the company is when faced with setbacks and downturns. This is the other, sometimes underappreciated, side of the return equation.
driving growth, tempering risk
Every company in which we invest must possess certain financial and operational characteristics, amongst them:
- High levels of profitability and cash generation
- Defendable market positions
- Robust balance sheets with low levels of debt
- Strong brands
- Accomplished management teams
In our experience, these attributes have typically been reliable indicators of a company’s ability to sustain high growth through cycles.
Importantly, these same characteristics are also frequently indicative of a resilient business. Durable cash flows,
market leadership, astute management and low levels of debt can all serve as ballast during times of economic or
market stress.
Or they can be deployed by companies to go on the offensive, empowering them to invest counter-cyclically and
take market share whilst weaker peers are forced to retrench. In short, they can be both mitigators of risk and
engines of growth.
Applying these characteristics to the portfolio level can potentially provide significant downside protection for
investors. Here, looking back at the two largest and most prolonged global equity market drawdowns of the last
three decades is instructive.
gLOBAL FINANCIAL CRISIS
During the bear market that accompanied the Global Financial Crisis, the maximum drawdown of the MSCI World Index was -54% between October 2007 and March 2009. It took 53 months for the index to recover to its previous high.
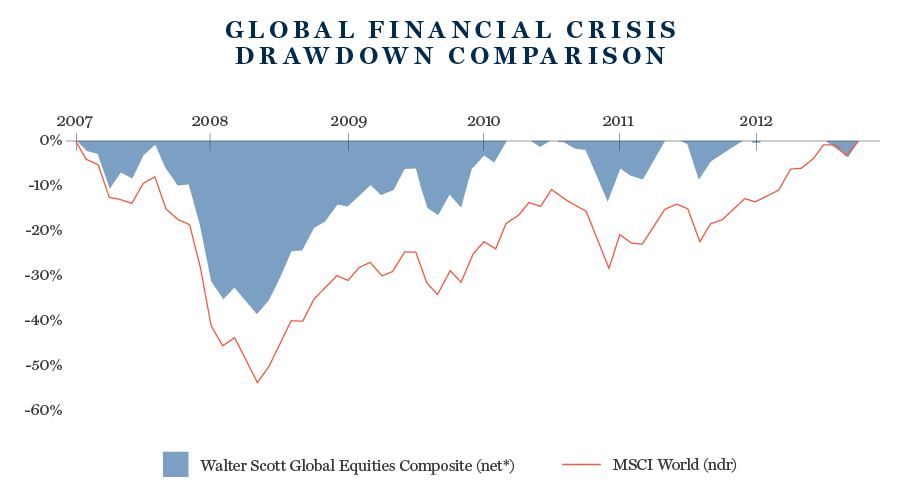
Over the same period, Walter Scott’s Global Equity strategy drawdown was markedly lower at -39%.
DOTCOM CRASH
The maximum drawdown of the MSCI World Index during the dotcom crash of the early 2000s was 47%. Recovery took 40 months. By comparison, Walter Scott’s Global Equity strategy declined 27% over this period, recovering in 25 months.

Furthermore, the larger the drawdown, the larger the subsequent gain required for a portfolio to return to its previous high. In the case of the MSCI World Index, the percentage gain required was 118% in the GFC and 88% in the Dotcom crash. For the Walter Scott Global Equity strategy, it was 63% and 38%, respectively.
The experience of Walter Scott’s International Equity strategy is similar, if somewhat less pronounced during the Dotcom crash (see table below).

lESSONS FROM HISTORY
There is a tendency to forget the frequency with which these bouts of market stress occur, part of what the great Canadian-American economist John Kenneth Galbraith called the “extreme brevity of the financial memory”. Markets are innately optimistic organisms.
By some estimates, however, the US stocks have on average suffered a bear market every six years over the past century and a half. The median decline was -33%. During such periods, the meaningful downside protection afforded by a well-diversified portfolio of resilient companies can make a significant contribution to investors’ overall long-term returns.
Source: Walter Scott, MSCI. Returns are shown in USD. *Net of fee returns reflect the deduction of model management fees and are calculated in the same manner as gross of fee returns. A 0.75% model management fee has been applied. **Drawdown periods have been defined by the benchmark. Recovery period is measured from trough of benchmark return for both composite and benchmark.
Important Information
This article is provided for general information only and should not be construed as investment advice or a recommendation. This information does not represent and must not be construed as an offer or a solicitation of an offer to buy or sell securities, commodities and/or any other financial instruments or products. This document may not be used for the purpose of an offer or solicitation in any jurisdiction or in any circumstances in which such an offer or solicitation is unlawful or not authorised.
Stock Examples
The information provided in this article relating to stock examples should not be considered a recommendation to buy or sell any particular security. Any examples discussed are given in the context of the theme being explored.
Past Performance
Past performance is not a guide to future returns and returns may increase or decrease as a result of currency fluctuations. The objective mentioned may therefore not be reached. Many factors affect investment performance including changes in market conditions, interest rates, currency fluctuations, exchange rates and in response to other economic, political, or financial developments. Investment return and principal value of an investment will fluctuate, so that when an investment is sold, the amount returned may be less than that originally invested.